K.Khirose, A.Nishiyama
St. Lukes International Hospital, Tokyo city
Unifying examination of clinical-neurological and NLS research analyses of vertebrobasilar system strokes was performed; key role of NLS in diagnosing of strokes was established. 203 patients underwent brain NLS procedure, vertebrobasilar stroke was diagnosed in 153 patients. Control group was made of 50 patients with no organic changes in brain structures. Practically convenient classifier of vertebrobasilar system strokes which considers lesion focus localization, pathogenetic stroke type and stage of disease was developed based on NLS researches data. Comparison of clinical-neurological data with NLS-research results was performed; it showed insufficiency of clinical-neurological examination results and necessity of NLS-examination in strokes diagnostics.
Introduction
Vascular affection of nervous system is one of the major problems in modern medicine. Stroke is the 2nd mortality factor (oncological diseases hold 1st place) and 1st place in primary disablement causes in Japan.
Vertebrobasilar artery system strokes consist about 13% of all cerebral strokes – ishemic strokes take 75% and haemorrhagic strokes take 25% among them. Vertebrobasilar system hematomas take 5-10% of all intracerebral hemorrhages, ischemic strokes take about 18% of all brain strokes.
In case of vertebrobasilar system strokes, mortality rate is several times higher than in case of hemispheric ones due to anatomical features of stem part: there are many vital centers concentrated on a small brain area: breath, vasomotor, swallowing regulation center and others.
Material and methods
Clinical-neurological and NLS-examinations data was analyzed in 203 patients. Vertebrobasilar arterial system stroke was diagnosed in 153 patients; patients age from 23 to 85 years. Mature men is the most affected group (30.1%). Control group consisted of 50 patients with no organic changes in brain: NLS-data of their examination was taken as a basis for cerebellum and brain stem NLS-anatomy study.
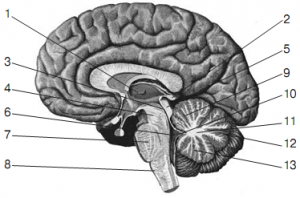
Pic. 1. Anatomical midsection of brain along in a saggital plane (by R.D. Sinelnikov).
1 – thalamus; 2 – conarium; 3– cerebral aqueduct; 4 – mesencephalon peduncle; 5– tectum of mesencephalon; 6 – IV ventricle; 7 – pons varolii; 8 – prolate pons; 9 – superior vermis; 10 – velum; 11 – medullary body of cerebellum; 12 – great horizontal fissure; 13 – inferior vermis.
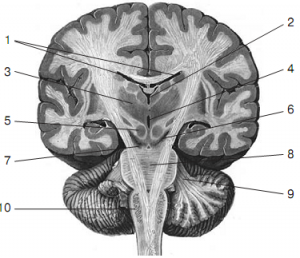
Pic. 2. Anatomical midsection of brain along in a frontal plane (by R.D. Sinelnikov).
1 – lateral ventricles; 2 – III ventricle; 3 – thalamus; 4 – cerebral aqueduct; 5 – red nucleus of mesencephalon; 6 – black substance of mesencephalon peduncle (a borderline between mesencephalic tegmentum and a base); 7 – mesencephalon peduncle; 8 – pons varolii; 9 – middle cerebellar peduncle; 10 – medulla oblongata.
Clinical-ray examination of patients included the following research methods:
• clinical-neurological and laboratory;
• instrumental;
• NLS.
Anamnesis data and overall neurological status of the patient were considered when using clinical-neurological examination. All patients were taken clinical blood, urine analyses and biochemical blood assay. 15 (9.8%) patients underwent NLS-angiography of neck vessels; various signs of vertebral arteries affection (atherosclerosis, hypoplasia, deformation and etc.) were registered in all patients according to the results of spectral-entropy analysis (SEA).
All 203 patients underwent NLS examination using «Metatron»-4025 system (Institute of Practical Psychophysics, Russia) with «Metapathia Hospital» software with possibility of both two-dimensional and three-dimensional imaging and spectral-entropy analysis (SEA).
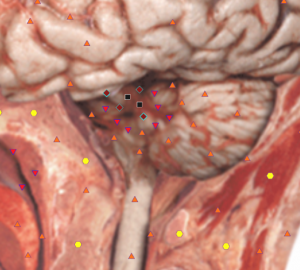
Pic. 3. Computed NLS-graphy. Cerebellar infarction. There is a hyperchromogenic area in a vermis (6 points at Fleindler’s scale).
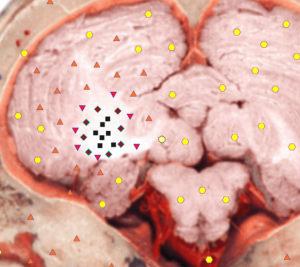
Pic. 4. Computed NLS-graphy. Cerebellar infarction. There is a hyperchromogenic area with relatively distinct borders in a right hemisphere of cerebellum.
Results and Discussion
We have developed vertebrobasilar system strokes classifier, which includes stroke type, lesion location and extent, as well as disease stage based on clinical-neurological data and NLS results analysis.
Patients distribution depending on disease stage is shown in table.
Distribution of vertebrobasilar system stroke patients (I and II types) depending on disease stage.
| Stage | Ishemic stroke | Number of patients, n (%) | Stage | Hemorrhagic stroke | Number of patients, n (%) |
| Acute | 0-5 days | 60 (39,2) | Acute | 0-2 days | 4 (2,6) |
| Subacute | 6-21days | 50 (32,7) | Early subacute | 3-7 days | 20(13,1)|29 (18,9) |
| Late subacute | 8-14 days | 9 (5,9) | |||
| Organizations | >2 weeks | 5 (3,3) | Organizations | >2 weeks | 5 (3,3) |
| Total | 115 (75,2) | Total | 38 (24,8) |
Table data shows that majority of vertebrobasilar system ischemic stroke patients (60 persons) were examined in acute disease stage.
Subacute stage of ischemic brain lesion was registered in 50 patients. Hemorrhagic stroke patients (29 persons) were mainly in sub-acute disease stage.
Disease course and stroke outcome factors depend on process location and its spread. In this regard, strokes developed in vertebrobasilar arterial system both in ischemic and hemorrhagic lesion type are divided into three groups and four subgroups:
1st group – cerebellum affection (69– 45.1%);
2nd group – stem part of brain affection (72– 47.1%).
There are subgroups among them:
a – pons varolii affection (40– 26.1%);
b – thalamus affection (21– 13.7%);
c – oblongata affection (6– 3.9%);
d – midbrain affection (5– 3.3%).
3rd group – affection of two or more brain parts, blood-supplied by vertebrobasilar artery system (12–7.8%).
In case of ischemic and hemorrhagic lesions of stem-cerebellar brain structures, NLS–semiotics mainly depends on stroke stage.
Ischemic affection of stem-cerebellar structures. According to our own observations, diagnostic significant change period of NLS-picture in case of ischemic stroke begins 12-14 hrs. from the onset of disease when using NLS. Lesions can be detected on 3-dimensional images in this early period. Changes of neural tissue are registered in two-dimensional mode in later stages.
In case of acute ishemic strokes (0-5 days) MRT allowed detection of various disorders in brain parenchyme caused primarily by cytotoxic and vasogenic edemas. Thus lesions were detected more distinctly on 3D NLS-pictures and they resembled areas of increased chromogeneity (5-6 points according to Fleindler’s scale). During first 48 hours, ischemia lesion was increasing due to extension of infarction zone in some patients. It is notably that peculiarity of changes in the early period of ishemic stroke comes in the form of blurring contours of lesion focus.
Subacute stage of ishemic stroke (6-21 days) was characterized by demarcation increase of lesion contours. 3D NLS showed distinct bounded zones of infarction. Chromogeneity of these zones was still high (5-6 points according to Fleindler’s scale). Accompanied by hyperchromogeneity 3D NLS showed small segments of moderate chromogenic signal caused by increased protein contents.
Some necrotic patches began demonstrating clear boundaries in ischemic stroke organization stage (> 21 days) owing to edema absorption.
Demarcation due to gliosis began developing around necrosis lesion. Affection zone on NLS-grams usually decreased in size and gained sharp contours. About 6 weeks later necrotic masses were completely reabsorbed and replaced by glious tissue (or cyst was developing). 3D NLS displayed gliosis as increased chromogeneity zone, while cyst had achromogenic structure caused by liquor fluid.
Hemorrhagic lesions of stem-cerebellar structures. NLS-semiotics of hemorrhagic strokes has its features. In acute phase (first 2 days) diagnostics of hemorrhage is usually difficult, since blood signal is isochromogenic to surrounding brain white substance.
Early period of subacute stage (3-7 days) is characterized by moderately chromogenic imaging of damaged vessels (4 points according to Fleindler’s scale). Vessels changing process goes from periphery to the center, that is why bleeding in early subacute stage on 3D NLS was ring-shaped, thus hyperchromogenic area was surrounded by low chromogeneity zone.
Hemolysis and methemoglobin outcome in intercellular space, which is accompanied by the highest NLS-picture chromogeneity of lesion (6 points according to Fleindler’s scale) occurs in the later period of stroke subacute phase (7-8th day).
Increased chromogeneity zone continues to grow from periphery to center at hemorrhagic stroke organization stage (>14 days). After that hemosiderin repository slowly resolves and even several years later a moderate chromogeneity zone can be found in former hemorrhage area (3-4 points according to Fleindler’s scale), which is confirmed by spectral-entropy analysis.
Comparison of clinical-neurological and NLS-graphical data was conducted concerning similarities between preliminary clinical diagnosis and NLS + spectral-entropy analysis conclusions.
Clinical-neurological data was sufficient for diagnostics of ischemic or haemorrhagic stroke types (of any given localization) in 1/3 of vertebrobasilar system strokes cases (in 45 patients – 29.4%), i.e complete match of clinical diagnosis with NLS and spectral-entropy analysis data. Vertebrobasilar system stroke based on clinical-neurological data was diagnosed in 68 patients (44.4%), although type or localization within stem-cerebellar zone was not recognized, in other words, partial but quite significant difference compared to NLS data took place. Complete difference of clinical-neurological diagnostics compared to NLS-research data was found in 40 patients (26.1%), which was caused mostly by grave patient condition (unconsciousness, speech disorders, affection multiplicity, comorbidity and etc.).
Conclusion
NLS is one of the most informative vertebrobasilar arterial stroke-detecting method which allows specifying stroke type according to spectral-entropy analysis data (ischemic – 75.2%, hemorrhagic – 24.8%); it also allows detection of accompanying diseases and complications (chronic brain ischemia – 52.9%, fibrocystic changes – 15.5%, dislocation of brain midline structures – 11.7% and etc.).
The classifier we have developed (based on NLS and spectral-entropy analysis) allows specifying stroke type, its stage, localization and prevalence of the process.
Comparison of clinical-neurological and NLS-data had shown that in 1/3 of vertebrobasilar system stroke cases (29,4%) a complete analyses match was confirmed; partial match of diagnoses was confirmed in 44.4%. Complete difference between clinical-neurological diagnostics and NLS-research results was found in 26.2% of patients; but only NLS method allowed disease diagnosing with precise specification of stroke type, progression stage, localization and lesion spread.
References
1. Nakamura G., Nishiyama I. Brain ischemia. 2011.
2. Heiss W.D., Forsting M., Diener H.C. Imaging in cerebrovascular disease. Curr. Opin. Neurol. 2010; 13 (1): pages 67–78.
3. Firsching R., Huber M., Frowein R.A. Cerebellar hemorrhage: management and prognosis. Neurosurg. Rev. 1991; 14 (3): pages 191–194.
4. Vorlou Ch.P., Dennis M.S., Van Geyn Zh. Stroke: Disease management guide.
5. Artyukh V., Shovkoplyas Yu., Gavrilov A. «Computer nonlinear analysis method and its role in diagnostics»// Collection of scientific works of Institute of Practical Psychophysics « Actual problems in NLS- diagnostics». Vol. I. M.: Book, 2006, pages 9-12.