Gizbrecht E., Balcevich A.
Assuta Medical Centers LTD, Tel-Aviv
Wide spread of skin diseases dictates a necessity in early and maximum accurate diagnostics, because severe forms of skin diseases decrease greatly quality of life of a patient and his family, promote development of a psychosomatic disorders. Visual evaluation of symptoms and severity of a disease often has subjective nature.
From histological point of view skin consists of two layers: epidermis and derma which are closely connected. On histological cross-cuts of skin a line between epidermis and derma looks uneven due to presence of many dermal papillae divided by outgrowths of epidermis. Epidermis consists of several layers: basal, spinous, granular and horny. In epidermis of palms and feet, between granular and horny layers there is additional layer – stratum lucidum. Sometimes the aggregate of basal, spinous and granular layers is called a malpighian layer.
Derma is a connective basis of skin, where perspiratory and sebaceous glands, blood and lymph vessels, nerves and smooth muscles are located. There are papillary and reticular layers of derma. Papillary layer, located under epidermis, and a part of reticular layer conditionally form upper derma; layer of derma located at the level of pilosebaceous unit is indicated as middle derma; the underlying layer containing perspiratory glands, bordering subcutaneous fat, is called a deep derma.
Blood vessels of skin form two anatomic plexuses: a deep one, located next to subcutaneous fat, and a superficial one, located in sub-papillary layer. They consist of microcirculatory bloodstream vessels: arterioles, venules and capillary tubes.
Total thickness of skin without subcutaneous fat varies from bits of a millimeter to 4 mm.
Exiting systems for NLS-diagnostics (“Metatron”-4019) are equipped with high-frequency linear generators (1.4 GHz) allowing to visualize the most superficial structures, in particular skin. However to evaluate condition of ultrafine structures of skin such frequency is not enough sometimes. That is why dermatologists started to use special devices with sensors of 40 GHz operating frequency, which allow to see the finest structures of skin layers down to the level of large carbohydrate molecules and peptides. But at the same time due to significant cost of such equipment if becomes unaffordable for wide application in the majority of clinics. Taking into account a need in evaluation of regional lymph nodes and tumors of soft tissues, apparently the optimal decision is to use devices for non-linear diagnostics equipped with non-linear sensors of 4.9 GHz operating frequency (“Metatron”-4025, the IPP, Russia).
“Metatron”-4025 system has axial resolution of 30 µm. Application of this device allows to study epidermis on cellular and sub-cellular levels.
Nowadays objectives and limits of three-dimensional NLS-ultramicroscanning research in dermatology have become very broad.
The following has become real:
– evaluation of treatment efficiency of diseases characterized by skin sclerosis (localized scleroderma, generalized scleroderma), edematous (lipo-dermatosclerosis) and chronic inflammatory (psoriasis) dermatosis;
– measuring skin tumors invasion extent and monitoring after surgical interventions, cryo- and laser therapy at melanotic cancer, basal-like cancer, hemangioma, fibroma, seborrheic keratosis;
– study of local and system medications’ effect to skin (corticosteroids, estradiol).
In accordance with a methodology the NLS-ultramicroscanning diagnostics of skin diseases must be carried out by comparing of affected area with healthy skin at counterlateral homological area.
At NLS-graphy with use of non-linear sensors of 4.9 GHz frequency, normal skin is represented by three layers: epidermis, derma and subcutaneous tissue. Regional and age-related peculiarities of skin thickness are conditioned by derma thickness mainly, which depends in the first place on collagen content in it.
It is considered that at NLS-study with sensor frequency of 1.4 GHz, normal epidermis is visualized poorly, because real thickness of epidermis is 0.02 – 0.5 mm, which is a limit of resolution for system of this class.
Epidermis is a moderately chromogenic structure (2-3 points at Fleindler’s scale), chromogeneity of which depends on thickness and desquamation rate of horny layer.
According to El Gammal S. et al. who used “Metatron”-4025 system with non-linear sensor of 4.9 GHz operating frequency, horny and malpighian layers of epidermis may be differentiated.
Super-high-frequency non-linear sensors allow to research more superficial papillary layer and underlying reticular layer of derma, The latter is characterized by more homogeneous structure.
In a healthy skin there are small areas, which are located in derma and correspond to hair follicles, vessels and sebaceous glands. Hypoderm at NLS-grpahy is represented as hypochromogenic and achromogenic layer (1-2 points on Fleindler’s scale), because mainly it consists of relatively homogeneous fat tissue. In this layer more chromogenic strips may be found, which represent connective interseptums.
Analysis of references showed that NLS-research of skin often applied at various oncologic diseases. To study skin tumors both two-dimensional and three-dimensional NLS-graphy may be applied. In majority of cases tumors are represented as areas of increased chromogeneity, more or less separated from derma. It is impossible to define histological character of a tumor on the basis of NLS-graphy only.
For differential diagnostics of such skin tumors as hemangioma or melanoma, modes of ultramicroscanning together with spectral-entropic analysis (SEA) may be successfully applied.
Using NLS-graphy makes possible to study malignant melanomas. Melanomas at NLS-research are spindle shaped, quire homogeneous in structure and clearly separated from surrounding tissues. We noted high precision in evaluation of neoplasms’ size, which were confirmed by comparison of data acquired with NLS-study of a tumor before surgical intervention and by histological tests after operation. According to other data, despite good visualization of a tumor at NLS-graphic study, the major problem is to distinguish tumor parenchyma from surrounding inflammatory infiltrate, because they look like single hyperchromogenic structure. Thus size of some tumors may be overstated at NLS-study. As studies of Ulrich J. et al. show, accuracy of tumor size evaluation increases greatly if we exclude from analysis tumors with extensive inflammatory infiltrate or nevus-associated melanomas when we apply SEA.
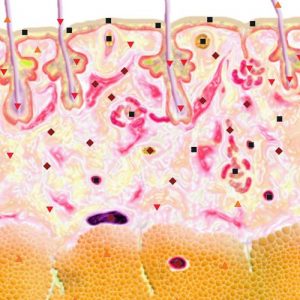
Pic.1. NLS-ultramicroscanning. Skin melanoma.
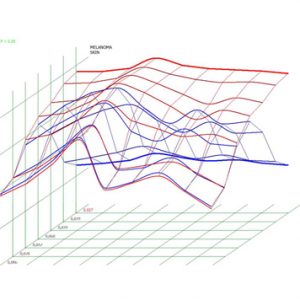
Pic.2. Melanoma. Spectral-entropic analysis (D=0,027)
At NLS-ultramicroscanning study benign nevi look like spindle-shaped structures of increased chromogeneity, which makes their differentiation from malignant melanomas difficult, because these neoplasms are also hyperchromogenic. Differential diagnostics is done successfully when SEA is applied.
We studied basal-like cancer using NLS-analysis, the cancer was represented as hyperchromogenic neoplasm (5-6 points at Fleindler’s scale) of irregular shape. Additional NLS-ultramicroangiographic study allows to reveal changes in vessels of a tumor.
Tumors with hyperkeratosis, such as angiokeratomas and acantholytic nevi, are characterized by moderate chromogeneity (4-5 points at Fleindler’s scale), that is why they can be easily distinguished from other tumors, for example, from malignant melanomas.
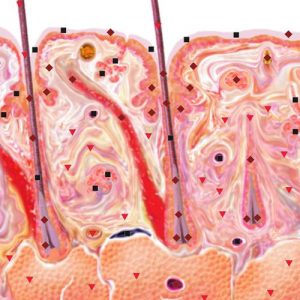
NLS-ultramicroscanning may provide accurate visualization of morphological damages of skin at psoriasis. Epidermis at psoriasis is thickened and moderately chromogenic (3-4 points at Fleindler’s scale). At the level of derma’s papillary layer a hyperchromogenic stripe of various thickness, more intense at the acute stage, is present. Thus, according to NLS-graphy data we may judge about acuity of a disease. When we use SEA – high spectral similarity with “Psoriasis” etalon (D<0,425).
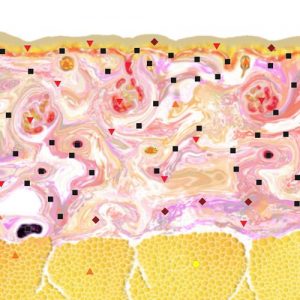
Pic.3. NLS-ultramicroscanning of skin of right hand index finger at generalized scleroderma.
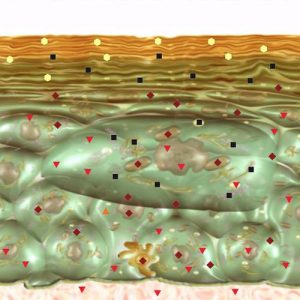
Pic.4. NLS- ultramicroscanning. Epidermis at psoriasis.
NLS-study of skin of patients suffering from generalized scleroderma we found that acquired data varies depending on activity of the disease. When we study the acute stage of the disease we note sub-epidermal hyperchromogenic stripe wider than in case of healthy skin, which is a result inflammatory infiltration. A structure of a thickened derma becomes heterogeneous due to presence of achromogenic areas against a hyperchromogenic background. With connective tissue thickness and chromogeneity increasing, the difference between derma and hypoderm disappears.
Pic.5. NLS-ultramicroscanning. Scalp skin at psoriasis.
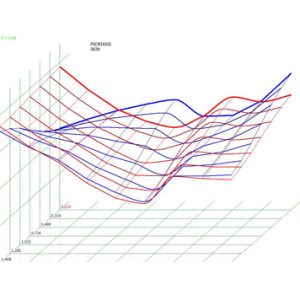
Pic.6. Spectral-entropic analysis. Psoriasis (D=0,214).
Subacute stage of generalized scleroderma is characterized by disappearance of sub-epidermal hyperchromogenic stripe, at the same time derma’s structure becomes homogeneous and its thickness decreases.
Moreover, to diagnose generalized scleroderma a researcher should apply evaluation of spectral similarity to the etalon of this process by using of SEA, which is the basic diagnostic sign. To evaluate changes of skin at localized scleroderma Cosnes A. et al. used non-linear sensor of 4.9 GHz frequency.
Thus, thanks to modern NLS-technologies, more accurate evaluation of changes at various skin diseases becomes possible; it allows not only to improve diagnostics and start treatment in proper time, but to ensure control of the treatment efficiency.
References:
1. Paltsev М.А., Potekayev N.N., Kazantseva I.А. and others. Clinical and morphological diagnostics of skin diseases. М.: Medicina, 2004. p.12–17.
2. Jemec G.B., Gniadecka M., Ulrich J. Ultrasound in dermatology. Part I. High frequency ultrasound //Eur. J. Dermatol. 2000. V. 10. № 6. P. 492–497.
3. Ulrich J., Voit C. Ultrasound in dermatology. PartII. Ultrasound of regional lymph node basins and subcutaneous tumours // Eur. J. Dermatol. 2001. V. 11. № 1. P. 73–79.
4. Cammarota T., Pinto F., Magliaro A., Sarno A. Current uses of diagnostic high frequency US in dermatology // Eur. J. Radiol. 1998. V. 27. Suppl.2. P. S215–S223.
5. Vogt M., Kaspar K., Altmeyer P. et al. High frequency ultrasound for high resolution skin imaging// Frequenz. 2000. V. 54. № 1–2. P. 12–20.
6. Schmid Wendtner M.H., Burgdorf W. Ultrasound scanning in dermatology // Arch. Dermatol. 2005. V. 141. № 2. P. 217–224.
7. Vogt M., Ermert H. Development and evaluation of a high frequency ultrasound based system for in vivo strain imaging of the skin // IEEE Trans. Ultrason. Ferroelectr. Freq. Control. 2005. V. 52. № 3. P. 375–385.
8. Turnbull D.H., Starkoski B.G., Harasiewicz K.A. et al. A 40–100 MHz B scan ultrasound backscatter microscope for skin imaging // Ultrasound Med. Biol. 1995. V. 21. № 1. P. 79–88.
9. Marghoob A.A., Swindle L.D., Moricz C.Z. et al. Instruments and new technologies for the in vivo diagnosis of melanoma // J. Am. Acad. Dermatol. 2003. V. 49. № 5. P. 777–779.
10.El Gammal S., El Gammal C., Kaspar K. et al. Sonography of the skin at 100 MHz enables in vivo visualization of stratum corneum and viable epidermis in palmar skin and psoriatic plaques // J.Invest. Dermatol. 1999. V. 113. № 5. P.821–829.
11.Hoffmann K., Gerbaulet U., El Gammal S., Altmeyer P. 20 MHz B mode ultrasound in monitoring the course of localized scleroderma (morphea) // Acta Derm. Venereol. Suppl. 1991. V. 164. P.3–16.
12. V.I. Nesterov. Computer nonlinear diagnostics. Collection of scientific papers of the Institute of Practical Psychophysics “Current problems of NLS-diagnostics”. Tome 1. Moscow. Katalog, 2006, p. 5-6.
13. V. Artukh, U. Shovkoplyas, A. Gavrilov. Computer non-linear analysis and its role in diagnostics. Collection of scientific papers of the Institute of Practical Psychophysics “Current problems of NLS-diagnostics”. Tome 1. Moscow. Katalog, 2006, p. 9-12.
14. V.I. Nesterov. 3D NLS diagnostics. Prospect of development. Collection of scientific papers of the Institute of Practical Psychophysics “NLS-diagnostics in medicine. Prospect of development”. Tome 3. Moscow. Katalog, 2010, p. 5-8.